


We are excited to launch a weekly newsletter to highlight trends in the Municipal Bond market. Our newsletter presents key trends derived from observable Municipal Bond pricing data over a weekly period.
- Top 10 Muni Bond Winners & Losers
- Top 10 Muni State Winners & Losers
- 10 Yr Yield by State - All Muni
- 10 Yr Yield by State - GO Only
- 10 Yr Yield by State - REV Only
- Market Sentiment
- Top Quote Volume Movers
- Most Quoted Municipal Bonds
| TOP 10 BOND WINNERS | ||||||
| Rank | Bond Name | Coupon | Maturity | Chg | Price | Price - 1W |
| 1 | PR HWY/TRN-M | 5.00% | 07/01/32 | 11.72% | 43.09 | 38.57 |
| 2 | COLUMBUS BLDG AUTH-A | 3.00% | 01/01/24 | 9.41% | 104.54 | 95.54 |
| 3 | SAN BERNARDINO USD-QS | 8.05% | 02/01/23 | 6.56% | 116.51 | 109.33 |
| 4 | OHIO ST-A | 4.00% | 05/01/24 | 5.13% | 112.13 | 106.66 |
| 5 | BERWYN MUNI SEC-AGM | 5.73% | 01/01/49 | 4.05% | 132.91 | 127.74 |
| 6 | RESTRUCTURED-SER A-2- | 4.33% | 07/01/40 | 3.86% | 106.81 | 102.83 |
| 7 | OK MUN PWR SER B | 5.75% | 01/01/24 | 3.43% | 113.53 | 109.76 |
| 8 | ALVORD USD-B-CABS | 0.00% | 08/01/36 | 3.35% | 62.94 | 60.90 |
| 9 | COLORADO ST BLDG-H | 3.25% | 03/15/35 | 3.06% | 104.65 | 101.55 |
| 10 | INDIANAPOLIS BOND BK | 6.00% | 01/15/40 | 2.95% | 140.32 | 136.30 |
| TOP 10 BOND LOSERS | ||||||
| Rank | Bond Name | Coupon | Maturity | Chg | Price | Price - 1W |
| 1 | MA CONS LN-BABS | 5.46% | 12/01/39 | -5.16% | 125.09 | 131.90 |
| 2 | PALM BEACH TOWN-TXBL | 3.10% | 01/01/43 | -4.80% | 97.93 | 102.86 |
| 3 | NYC FIN-TXB-S-1B-BABS | 6.83% | 07/15/40 | -3.36% | 134.88 | 139.56 |
| 4 | L A WTR/PWR-C-BABS | 6.01% | 07/01/39 | -3.34% | 126.41 | 130.79 |
| 5 | MS DEV-TXB-B-JACKSON | 4.37% | 03/01/24 | -3.22% | 104.73 | 108.21 |
| 6 | DENVER SCHS-REF-B-TXB | 6.22% | 12/15/26 | -3.07% | 115.77 | 119.43 |
| 7 | GLENDALE REDEV AGY-TX | 8.35% | 12/01/24 | -2.71% | 123.05 | 126.47 |
| 8 | TULSA INDL-TXB-A-BABS | 6.13% | 09/01/24 | -2.28% | 113.78 | 116.43 |
| 9 | ST CHARLES SPL OBLG-C | 5.81% | 10/01/25 | -1.68% | 103.49 | 105.25 |
| 10 | FULTON DEV AUTH-B-TXB | 5.31% | 10/01/35 | -1.47% | 122.69 | 124.53 |
- Showcases the top 10 Muni Bond "Winners" and "Losers" based on price movements between 1/3/20 - 1/10/20
| TOP 10 STATE WINNERS | ||||
| Rank | State Name | Chg | Yld | Yld - 1W |
| 1 | MA | -48 bps | 1.59% | 2.08% |
| 2 | HI | -42 bps | 1.84% | 2.26% |
| 3 | IA | -29 bps | 1.63% | 1.92% |
| 4 | MN | -19 bps | 1.95% | 2.15% |
| 5 | WA | -19 bps | 1.81% | 1.99% |
| 6 | FL | -11 bps | 1.84% | 1.95% |
| 7 | CA | -9 bps | 2.13% | 2.22% |
| 8 | OR | -9 bps | 2.03% | 2.12% |
| 9 | MD | -7 bps | 2.13% | 2.20% |
| 10 | MS | -5 bps | 2.11% | 2.16% |
| TOP 10 STATE LOSERS | ||||
| Rank | State Name | Chg | Yld | Yld - 1W |
| 1 | NE | 56 bps | 2.42% | 1.85% |
| 2 | KS | 45 bps | 2.45% | 2.01% |
| 3 | DC | 32 bps | 2.32% | 2.00% |
| 4 | AZ | 32 bps | 2.48% | 2.16% |
| 5 | IL | 30 bps | 3.12% | 2.83% |
| 6 | MI | 28 bps | 2.46% | 2.18% |
| 7 | UT | 26 bps | 1.99% | 1.74% |
| 8 | AL | 21 bps | 2.13% | 1.92% |
| 9 | OH | 19 bps | 2.32% | 2.12% |
| 10 | MT | 18 bps | 2.27% | 2.09% |
- Showcases the top 10 Muni State "Winners" and "Losers" based on yield movements between 1/3/20 - 1/10/20
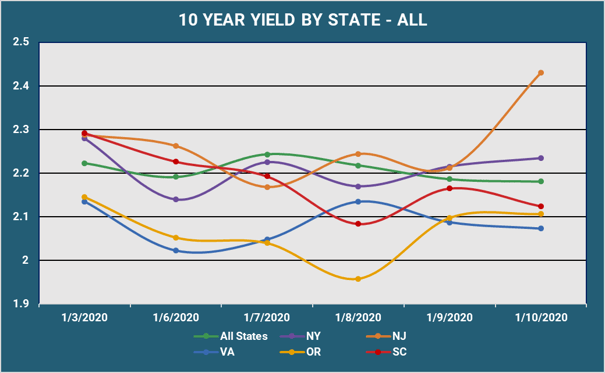
- Displays the average Muni 10 year yield by state between 1/3/20 - 1/10/20 (General Obligation and Revenue Bonds)
- Results are based on 5 select states, however, we offer data across all 50 states and U.S. territories
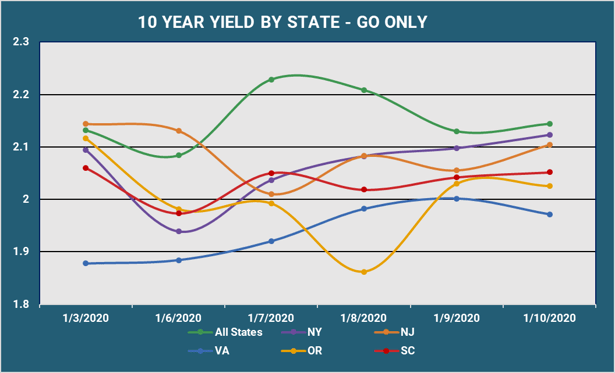
- Displays the average Muni 10 year yield by state between 1/3/20 - 1/10/20 (General Obligation Bonds only)
- Results are based on 5 select states, however, we offer data across all 50 states and U.S. territories
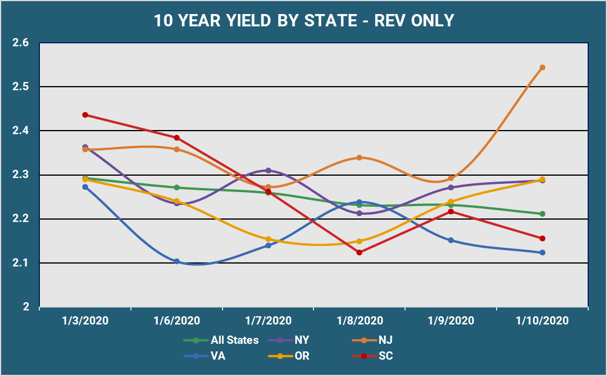
- Displays the average Muni 10 year yield by state between 1/3/20 - 1/10/20 (Revenue Bonds only)
- Results are based on 5 select states, however, we offer data across all 50 states and U.S. territories
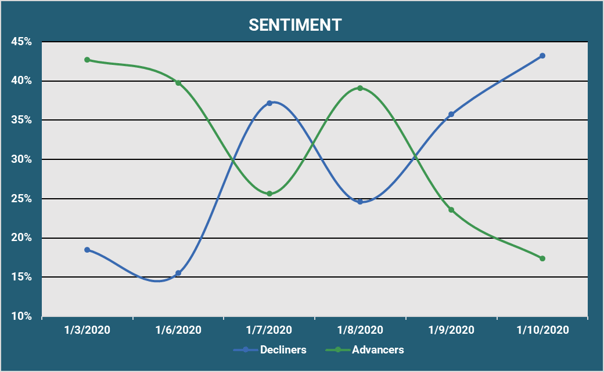
- Reveals the percent of Muni bonds increasing in price (Advancers) vs. decreasing in price (Decliners) between 1/3/20 - 1/10/20
| TOP QUOTE VOLUME MOVERS: THIS WEEK vs LAST WEEK | |||||||
| RANK | TRANCHE | COUPON | MATURITY |
PRIOR WEEK |
THIS WEEK |
INCREASE | % INCREASE |
| 1 | NEW JERSEY ST HLTH CA | 5.00% | 07/01/29 | 15 | 66 | 51 | 340% |
| 2 | SPRING BRANCH ISD | 4.00% | 02/01/36 | 5 | 49 | 44 | 880% |
| 3 | NEW YORK ST URBAN DEV | 4.00% | 03/15/42 | 8 | 50 | 42 | 525% |
| 4 | NYC TRANS FIN AUTH | 4.00% | 05/01/43 | 4 | 46 | 42 | 1050% |
| 5 | HONOLULU-A | 4.00% | 07/01/44 | 19 | 61 | 42 | 221% |
| 6 | GEORGIA ST-D | 5.00% | 02/01/24 | 7 | 42 | 35 | 500% |
| 7 | SAN ANTONIO TX INDEP | 4.00% | 08/15/35 | 17 | 50 | 33 | 194% |
| 8 | NASSAU CO NY -B | 5.00% | 04/01/49 | 1 | 33 | 32 | 3200% |
| 9 | SALT RIVER AZ PROJ AG | 5.00% | 01/01/34 | 3 | 33 | 30 | 1000% |
| 10 | ILLINOIS ST | 4.00% | 11/01/38 | 7 | 36 | 29 | 414% |
- Exhibits the Munis with the largest increase in quote volume for the week ending 1/3/20 vs. the week ending 1/10/20
| MOST QUOTED MUNIS | ||||
| RANK | TRANCHE | COUPON | MATURITY | DEALERS |
| 1 | MONTGOMERY CNTY PA HG | 5.00% | 09/01/33 | 14 |
| 2 | NEW JERSEY ST HLTH CA | 5.00% | 07/01/29 | 13 |
| 3 | NEW YORK ST DORM AUTH | 5.00% | 02/15/48 | 13 |
| 4 | MARYLAND ST HLTH & HG | 5.00% | 10/01/49 | 12 |
| 5 | NEW YORK-A-A-1 | 5.00% | 08/01/39 | 12 |
| 6 | NEW YORK CITY NY MUNI | 4.00% | 06/15/42 | 12 |
| 7 | NY ST URBAN DEV CORP | 3.00% | 03/15/49 | 12 |
| 8 | PUB FIN AUTH-A-REF | 4.00% | 10/01/49 | 12 |
| 9 | HONOLULU-A | 4.00% | 07/01/44 | 12 |
| 10 | NEW YORK ST URBAN DEV | 4.00% | 03/15/42 | 11 |
- Ranks the Munis that were quoted by the highest number of dealers between 1/3/20 - 1/10/20
Want free access to Solve's Real-Time Market Data and trends within the market for Municipal Bonds?
If you would like to see additional information, or if you have any feedback or questions, please feel free to reach out to us at info@solveadvisors.com or +1 646-699-5041.