


We are excited to launch a weekly newsletter to highlight trends in the Municipal Bond market. Our newsletter presents key trends derived from observable Municipal Bond pricing data over a weekly period.
- Top 10 Muni Bond Winners & Losers
- Top 10 Muni State Winners & Losers
- 10 Yr Yield by State - All Muni
- 10 Yr Yield by State - GO Only
- 10 Yr Yield by State - REV Only
- Market Sentiment
- Top Quote Volume Movers
- Most Quoted Municipal Bonds
| TOP 10 BOND WINNERS | ||||||
| Rank | Bond Name | Coupon | Maturity | Chg | Price | Price - 1W |
| 1 | PR-REF-A | 4.13% | 07/01/22 | 9.15% | 69.25 | 63.44 |
| 2 | CALIFORNIA ST INFRAST | 3.67% | 07/01/34 | 5.15% | 108.56 | 103.24 |
| 3 | CENT PUGET TRN S/TAX | 4.75% | 02/01/28 | 4.67% | 112.90 | 107.87 |
| 4 | BI-ST DEV AGY OF THE | 5.00% | 10/01/30 | 3.22% | 134.21 | 130.03 |
| 5 | FL DEV FIN CORP-A-AMT | 6.25% | 01/01/49 | 3.18% | 99.31 | 96.25 |
| 6 | ARIZONA HEALTH FACS | 1.48% | 01/01/37 | 2.78% | 99.73 | 97.03 |
| 7 | PALOMAR CDD-D | 4.00% | 08/01/46 | 2.15% | 114.27 | 111.86 |
| 8 | PALM BEACH TOWN-TXBL | 3.00% | 01/01/37 | 1.64% | 102.87 | 101.21 |
| 9 | PORTSMOUTH-B-REF-TXBL | 2.50% | 02/01/34 | 1.63% | 96.04 | 94.50 |
| 10 | NJ ECON DEV AUTH | 4.00% | 06/15/44 | 1.63% | 106.76 | 105.05 |
| TOP 10 BOND LOSERS | ||||||
| Rank | Bond Name | Coupon | Maturity | Chg | Price | Price - 1W |
| 1 | CA HLTH ST FRANCIS-C | 5.88% | 11/01/23 | -2.64% | 112.45 | 115.50 |
| 2 | DOWNTOWN SMYRNA DEV | 5.25% | 02/01/28 | -2.59% | 118.94 | 122.11 |
| 3 | STOCKTON USD-TXB-C | 7.08% | 08/01/27 | -2.08% | 121.51 | 124.09 |
| 4 | MS DEV-BABS-HARRISON | 6.59% | 01/01/35 | -1.99% | 130.03 | 132.67 |
| 5 | WALNUT VLY UNIF SD | 2.30% | 08/01/28 | -1.53% | 98.48 | 100.01 |
| 6 | TODD CREEK MET-A-REF | 5.00% | 12/01/23 | -1.51% | 108.84 | 110.50 |
| 7 | HORRY CNTY | 5.00% | 07/01/40 | -1.49% | 102.20 | 103.75 |
| 8 | MCGEE CREEK WTR | 6.00% | 01/01/23 | -1.48% | 108.79 | 110.42 |
| 9 | MASON CO SD#309-REF | 4.00% | 12/01/36 | -1.31% | 112.23 | 113.72 |
| 10 | BAY AREA TOLL-F-2 | 6.26% | 04/01/49 | -1.30% | 154.36 | 156.40 |
- Showcases the top 10 Muni Bond "Winners" and "Losers" based on price movements between 12/27/19 - 1/3/20
| TOP 10 STATE WINNERS | ||||
| Rank | State Name | Chg | Yld | Yld - 1W |
| 1 | AZ | -92 bps | 2.16% | 3.07% |
| 2 | MI | -37 bps | 2.18% | 2.55% |
| 3 | OH | -37 bps | 2.10% | 2.47% |
| 4 | IL | -33 bps | 2.83% | 3.16% |
| 5 | MO | -33 bps | 2.00% | 2.33% |
| 6 | UT | -32 bps | 1.74% | 2.05% |
| 7 | KS | -31 bps | 2.01% | 2.31% |
| 8 | CO | -27 bps | 1.97% | 2.24% |
| 9 | MT | -27 bps | 2.10% | 2.37% |
| 10 | IA | -27 bps | 1.92% | 2.19% |
| TOP 10 STATE LOSERS | ||||
| Rank | State Name | Chg | Yld | Yld - 1W |
| 1 | GA | 42 bps | 2.24% | 1.82% |
| 2 | WI | 14 bps | 1.94% | 1.80% |
| 3 | SC | 10 bps | 2.06% | 1.96% |
| 4 | MN | 9 bps | 2.14% | 2.06% |
| 5 | AL | 8 bps | 1.92% | 1.84% |
| 6 | FL | 6 bps | 1.95% | 1.89% |
| 7 | NV | 6 bps | 2.20% | 2.14% |
| 8 | NJ | 5 bps | 2.14% | 2.09% |
| 9 | NY | 5 bps | 2.07% | 2.02% |
| 10 | OR | 3 bps | 2.11% | 2.08% |
- Showcases the top 10 Muni State "Winners" and "Losers" based on yield movements between 12/27/19 - 1/3/20
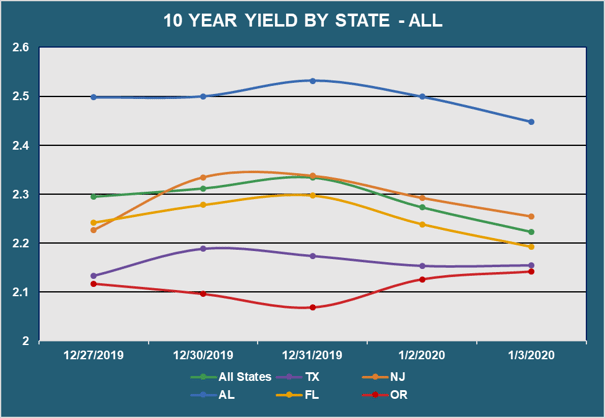
- Displays the average Muni 10 year yield by state between 12/27/19 - 1/3/20 (General Obligation and Revenue Bonds)
- Results are based on 5 select states, however, we offer data across all 50 states and U.S. territories
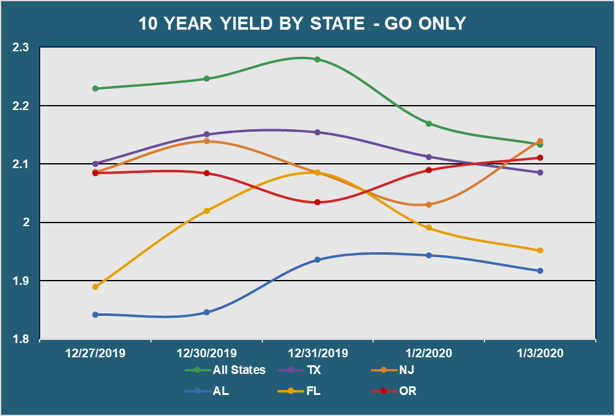
- Displays the average Muni 10 year yield by state between 12/27/19 - 1/3/20 (General Obligation Bonds only)
- Results are based on 5 select states, however, we offer data across all 50 states and U.S. territories
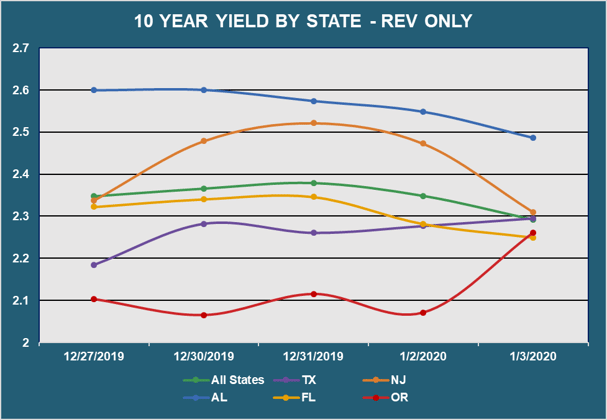
- Displays the average Muni 10 year yield by state between 12/27/19 - 1/3/20 (Revenue Bonds only)
- Results are based on 5 select states, however, we offer data across all 50 states and U.S. territories
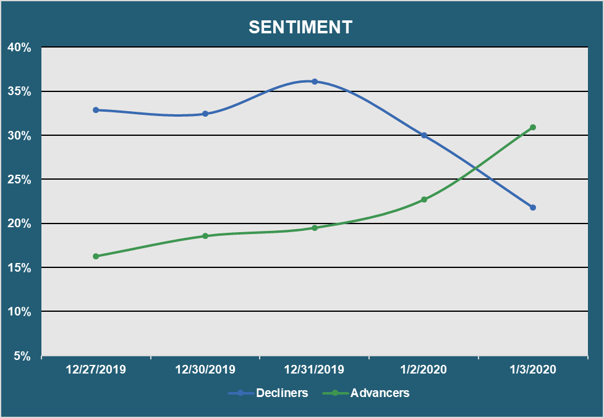
- Reveals the percent of Muni bonds increasing in price (Advancers) vs. decreasing in price (Decliners) between 12/27/19 - 1/3/20
| TOP QUOTE VOLUME MOVERS: THIS WEEK vs LAST WEEK | |||||||
| RANK | TRANCHE | COUPON | MATURITY |
PRIOR WEEK |
THIS WEEK |
INCREASE | % INCREASE |
| 1 | WASHOE CO NV SD-B | 5.00% | 10/01/29 | 1 | 29 | 28 | 2800% |
| 2 | LOS ANGELES CA DEPT O | 5.00% | 07/01/44 | 13 | 38 | 25 | 192% |
| 3 | DIST OF COLUMBIA-A | 5.00% | 06/01/34 | 20 | 41 | 21 | 105% |
| 4 | EDINBURG CONS ISD-REF | 5.00% | 02/15/30 | 6 | 27 | 21 | 350% |
| 5 | OHIO ST-A | 4.00% | 02/01/31 | 4 | 24 | 20 | 500% |
| 6 | WESTCHESTER CNTY -D | 4.00% | 12/15/29 | 9 | 28 | 19 | 211% |
| 7 | MT SAN ANTONIO CCD-A | 5.00% | 08/01/44 | 6 | 24 | 18 | 300% |
| 8 | SAN FRANCISCO ARPT 20 | 5.00% | 05/01/45 | 16 | 34 | 18 | 113% |
| 9 | CALIFORNIA | 3.00% | 10/01/34 | 6 | 24 | 18 | 300% |
| 10 | CALIFORNIA ST-REF | 5.00% | 08/01/36 | 4 | 20 | 16 | 400% |
- Exhibits the Munis with the largest increase in quote volume for the week ending 12/27/19 vs. the week ending 1/3/20
| MOST QUOTED MUNIS | ||||
| RANK | TRANCHE | COUPON | MATURITY | DEALERS |
| 1 | OHIO ST -A-COMMON SCH | 5.00% | 06/15/30 | 12 |
| 2 | NY ST URBAN DEV CORP | 3.00% | 03/15/49 | 12 |
| 3 | MONTGOMERY CNTY PA HG | 5.00% | 09/01/33 | 12 |
| 4 | COLUMBUS OH | 5.00% | 04/01/26 | 12 |
| 5 | NEW YORK CITY NY TRAN | 4.00% | 11/01/39 | 11 |
| 6 | DIST OF COLUMBIA-A | 5.00% | 06/01/34 | 11 |
| 7 | GLENDALE TRN EXCISE | 5.00% | 07/01/28 | 11 |
| 8 | OSCEOLA CNTY FL TRANS | 4.00% | 10/01/54 | 11 |
| 9 | MARYLAND ST HLTH &HGR | 5.00% | 10/01/49 | 11 |
| 10 | NY LIBERTY DEV CORP | 2.45% | 09/15/69 | 10 |
- Ranks the Munis that were quoted by the highest number of dealers between 12/27/19 - 1/3/20
Want free access to Solve's Real-Time Market Data and trends within the market for Municipal Bonds?
If you would like to see additional information, or if you have any feedback or questions, please feel free to reach out to us at info@solveadvisors.com or +1 646-699-5041.